

This is a powerful tool I learned to use from the edX course, Introduction to Computational Thinking and Data Science. This tool can be used at a variety of situations. It is part of the pylab module in python. What it basically does is it finds a curve which is best fit for given data points. We can give the degree of the equation of the curve. I will start with a simple example.
Almost all of who have chosen science for higher studies must have done the ohm's law experiment. We take the current readings of a circuit with a resistor load varying the voltage to calculate the resistance. We know that voltage and current have a linear relation when a resistive load is added. We have the equation
R = V/I
So we can either calculate R at various voltage and take an average, or we can plot this points on a graph and draw a line through points( actually a best line which is closer to all points) and find its slope. For a straight line, we have the equation
Y = MX +C
Where M is the slope. In the case of ohm's law C = 0 and M = 1/R when X = V and Y = I. I have created a hypothetical current voltage readings of the experiment below for a circuit with 100Ω load.
| VOLTAGE | CURRENT |
| 10 | 0.12 |
| 20 | 0.19 |
| 30 | 0.32 |
| 40 | 0.41 |
| 50 | 0.48 |
| 60 | 0.63 |
| 70 | 0.71 |
| 80 | 0.83 |
| 90 | 0.87 |
| 100 | 1.03 |
When we take readings there will be some errors. That is why our current readings will not be perfect. To calculate this using python, first I created two arrays V and I.
>>> V = array([ 10,  20,  30,  40,  50,  60,  70,  80,  90, 100])
>>> I = array([ 0.12,  0.19,  0.32,  0.41,  0.48,  0.63,  0.71,  0.83,
                0.87,  1.03])
Now we can either calculate the resistance by finding average or using curve fitting. First let's find it using average
>>> V/I
array([  83.33333333,  105.26315789,   93.75      ,   97.56097561,
        104.16666667,   95.23809524,   98.5915493 ,   96.38554217,
        103.44827586,   97.08737864])
>>> mean(V/I)
97.482497470988321
It is a good value. It is close to 100. Now let's use the curve fitting method. We use the function polyfit() from the pylab module. It takes x, y and degree of the polynomial as it's input. According to the degree of the polynomial, it returns the coefficients. In this case, we know the degree of the polynomial is 1 since the relation is linear. Let's find the coefficients.
>>> c = polyfit(V,I,1)
>>> c
array([ 0.0100303 ,  0.00733333])
If you are wondering what this value means, let me explain. These values represent M and C in the equation Y = MX + C. In this context we have I = V/R. So here M = 1/R. In the output first value represents M and the second value represents C. We can see that second value is almost zero. Now let's calculate R.
>>> R = 1/c[0]
>>> R
99.697885196374614
See you get a better result for the R. This is the benefit of using curve fitting. This is equivalent to plotting points in the graph and drawing a line to calculate resistance by finding the slope. To clarify this idea, I will plot a graph of data points and a line calculated using the output of polyfit.
>>> plot(V,I,"ro")
[]
>>> plot(V,polyval(c,V))
[]
>>> show()
The first function is to plot the readings using red dots. The second one is to plot the calculated line using the output of polyfit. What the polyval() do is, it calculates the value of current using coefficients from polyfit for all the values in V. The graph looks like below
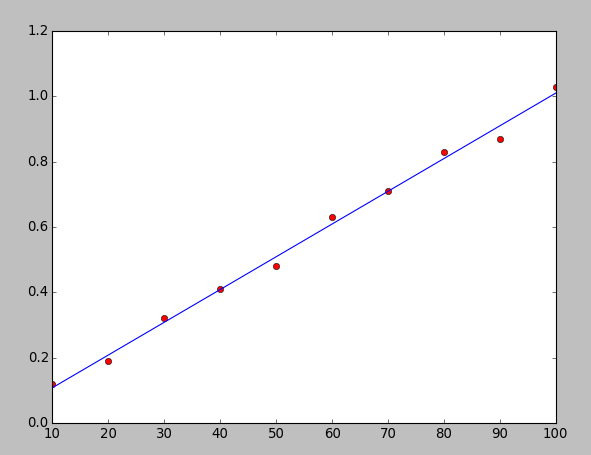
As you can see we have got quite a good graph. Doesn't this make the calculations easier, better and easy to understand? That is what I loved about this tool. You can use this tool in different situations. Some times to find these kinds of values or some times to calculate future values. Suppose if we have battery percentage of mobile for a few hours won't we be able to predict the expected remaining time with the battery? Think all the experiments done at your labs with messy graphs, won't it be much easier to do it with this tool?
Anyway, this example was a very simple one. I made it up so I could explain the functionality of this tools easily. It is not always gonna be linear graphs. Sometimes we won't even know what degree of polynomial should be used. We can try different degrees and check the graphs to see if the graph is a good fit. But as we are lazy we don't want to check every time we have to run a program. Also, programs are supposed to automate most of the things. So what do we do about that? There are methods to find the goodness of the fit. I will explain to you that in another post. Meanwhile, if you find a situation where we can use the curve fitting, comment below.